Broadway Lyric Analysis with Python
Category
ProgrammingAbout This Project
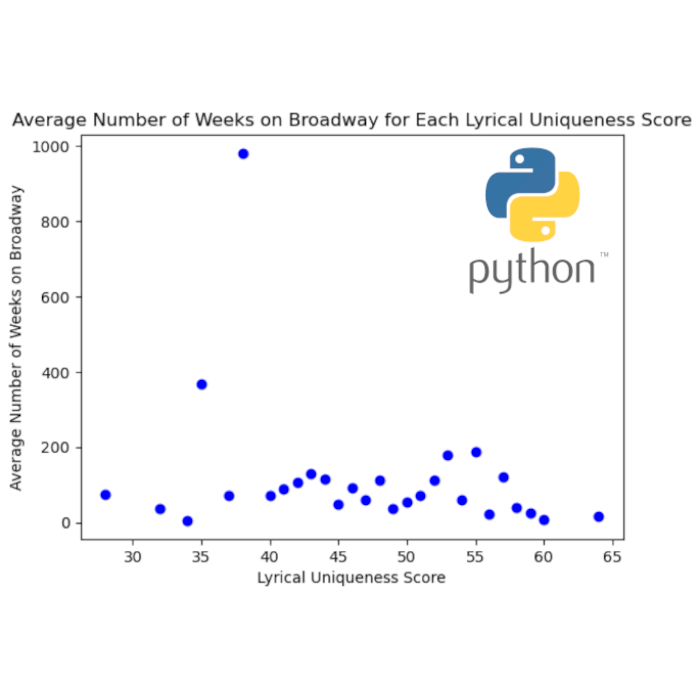
For the midterm project in my Software Design class, Data-Driven Stories, my partner and I set out to analyze the relationship between a Broadway musical’s lyrics and attendance with the overall goal of learning to more broadly utilize external APIs and various data science libraries (pandas, numpy, and matplotlib). Looking more specifically within our project domain, we looked to see if there was a relationship between the complexity of lyrics – which we defined as the uniqueness, or number of unique words over number of total words for this test – and the length of time (measured in weeks) that it stayed on Broadway.
To complete this task, we acquired a dataset from the CORGIS Data Library that detailed every Broadway performance over the past ~20 years provided by the Broadway League. While this provided a list of musicals and a way to compute the number of weeks on Broadway (through data manipulation with the Python pandas library), a way to actually get the lyrics was also required. To complete this, a Python library that accessed the Genius lyrics website was used. Identifying the correct album, songs, and eventual lyrics proved to be a challenge, but this library and the Genius API eventually provided the lyrics that could then be further analyzed programmatically.
Overall, we found that the uniqueness was not a contributing factor to the length a show was on Broadway, however, the project provided some great experience in Python.
The full project source code and an accompanying computational essay can be found on the project’s GitHub page.


